Population and Labor Force
Population Demographic
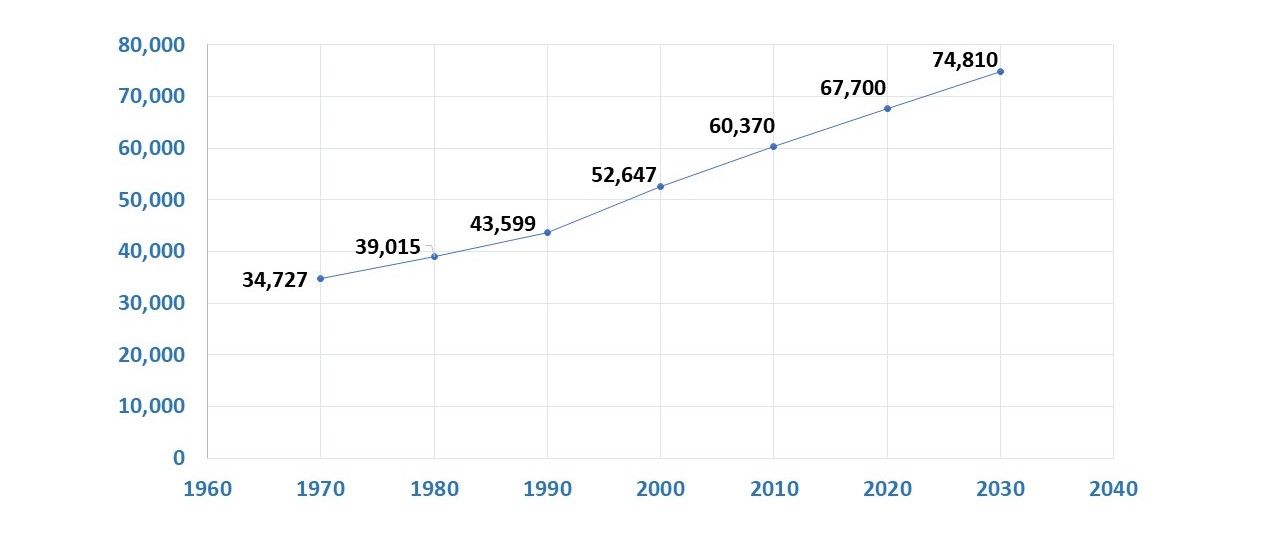
Population Growth
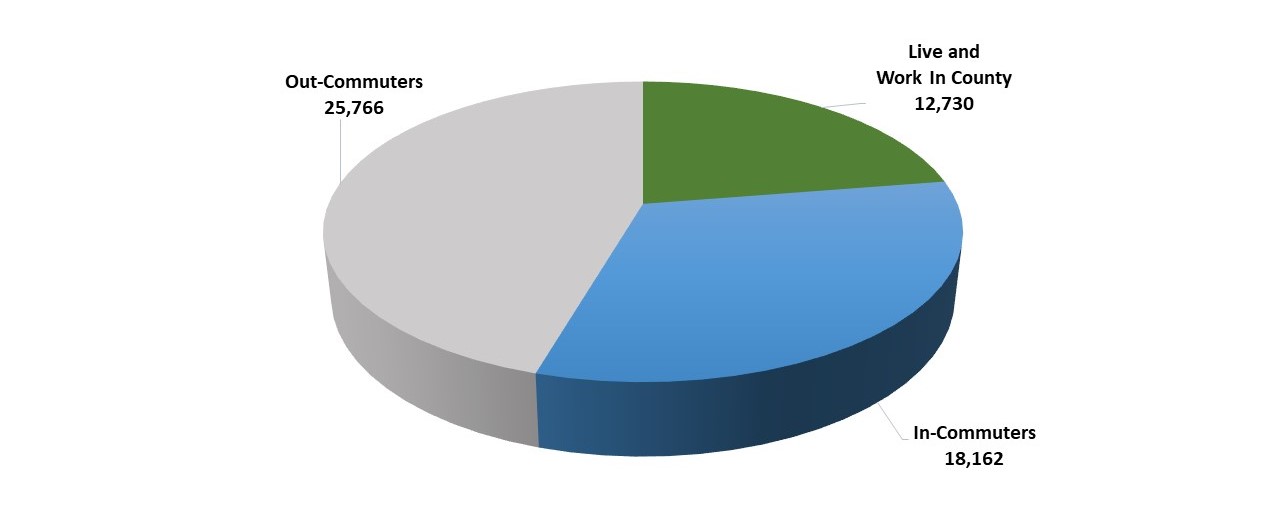
Commuting Patterns
Drive Time Population

Source: Department of Employment Workforce and Central SC Alliance
For more information about our demographics check out SC Power Team's Data Center.

LABOR FORCE INSIGHT: COUNT ON GROWTH
Kershaw County and the surrounding region are fast growing - over 18% over the last decade. That means industries have a rich labor pool of skilled workers to draw from to meet their employment needs. That’s good news for growing companies – today and in the future.
The good news continues as South Carolina is right-to-work and employment-at-will, and Kershaw County features a low unionization rate of 1.0%. Our workers will work with you to meet the challenges and opportunities faced in today’s every changing global markets.
ADD ITEM TO REPORT
As you navigate our website, you can use the “Add Page to Report” button add any page or property to a custom report that you can print out or save.