Population and Labor Force
Population Demographic
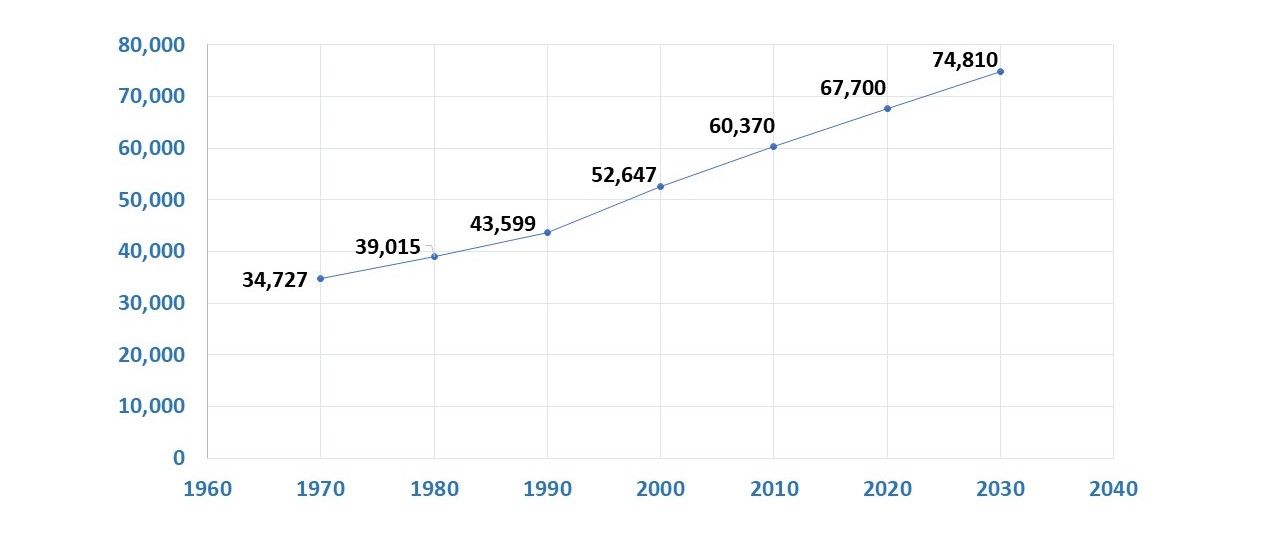
Population Growth
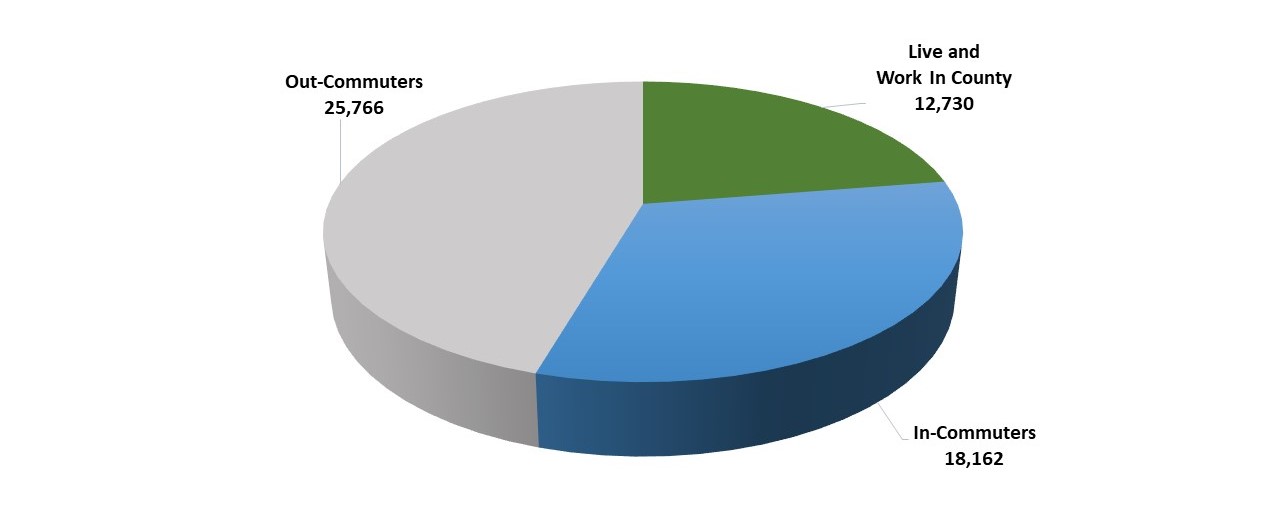
Commuting Patterns
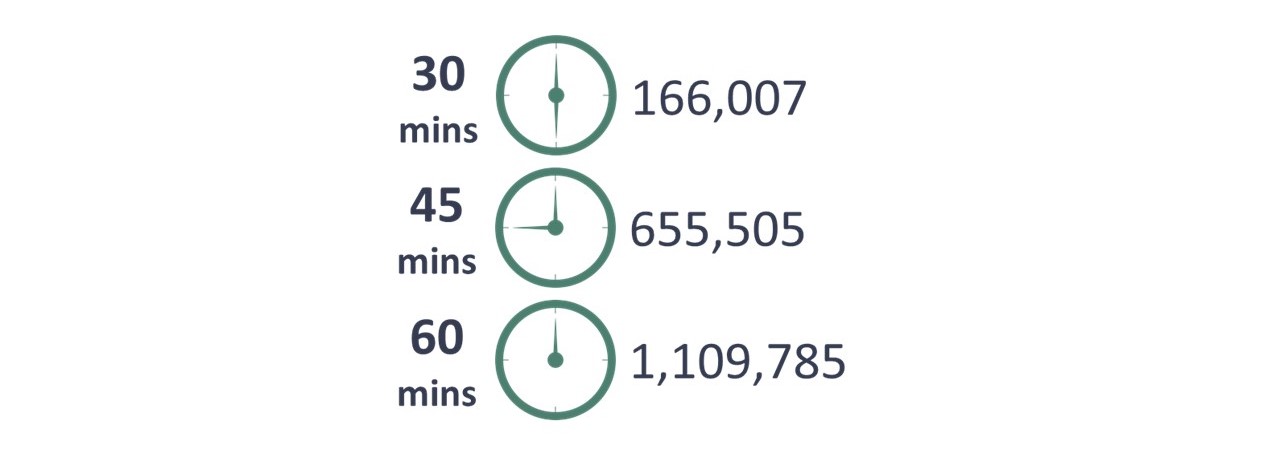
Drive Time Population
Source: Department of Employment Workforce and Central SC Alliance
For more information about our demographics check out SC Power Team's Data Center.
LABOR FORCE INSIGHT: COUNT ON GROWTH
Kershaw County and the surrounding region are fast growing - over 18% over the last decade. That means industries have a rich labor pool of skilled workers to draw from to meet their employment needs. That’s good news for growing companies – today and in the future.
The good news continues as South Carolina is right-to-work and employment-at-will, and Kershaw County features a low unionization rate of 1.0%. Our workers will work with you to meet the challenges and opportunities faced in today’s every changing global markets.


